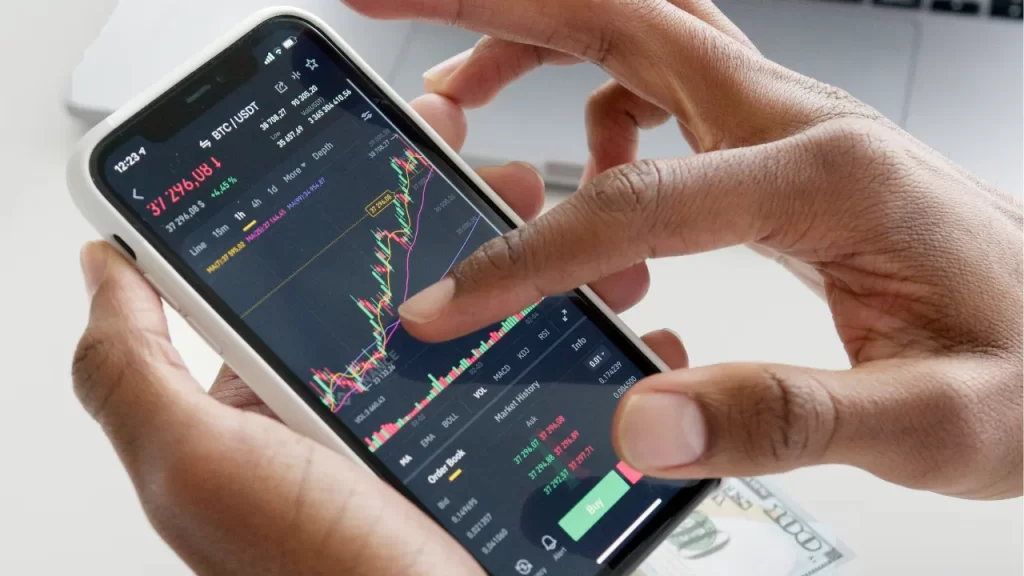

Understanding how to read a CFD trading chart is essential for making informed trading decisions.
Whether you’re a beginner or an experienced trader, mastering candlestick patterns, trends, and technical indicators will improve your ability to predict price movements and execute successful trades.
In this guide, we’ll break down everything you need to know about CFD trading charts, including candlesticks, trends, and key chart patterns.
Understanding the Basics of a CFD Trading Chart
A CFD trading chart visually represents an asset’s price movements over time.
Charts help traders identify trends, patterns, and key price levels for making informed trading decisions.
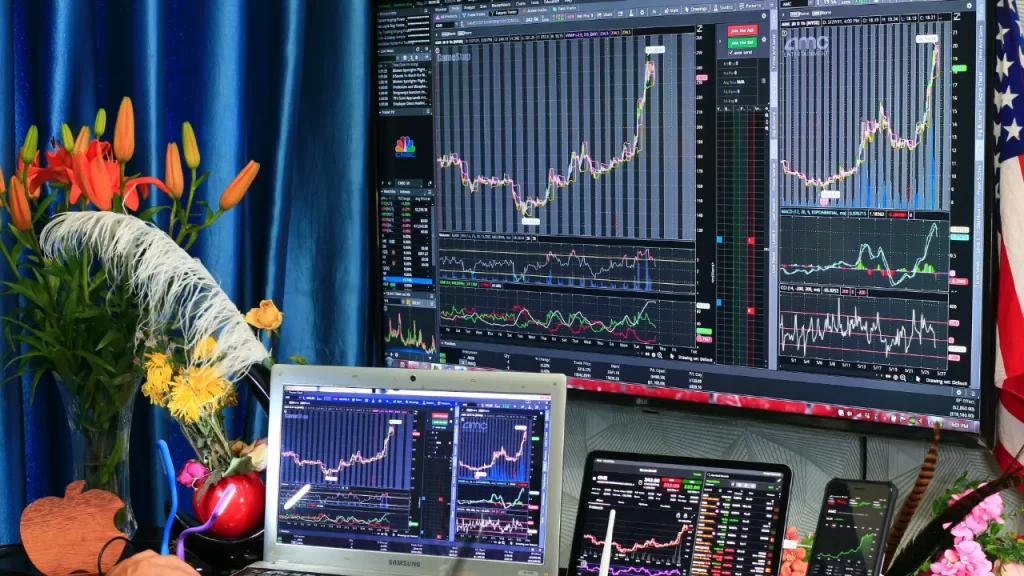
Key Components of a Trading Chart
- Price Axis (Y-Axis): Shows the asset’s price levels.
- Time Axis (X-Axis): Displays the time intervals (minutes, hours, days, etc.).
- Candlesticks or Bars: Represent price movement within a selected time frame.
- Indicators & Tools: Help analyze trends and momentum.
Now, let’s dive into candlestick charts, the most widely used chart type in CFD trading.
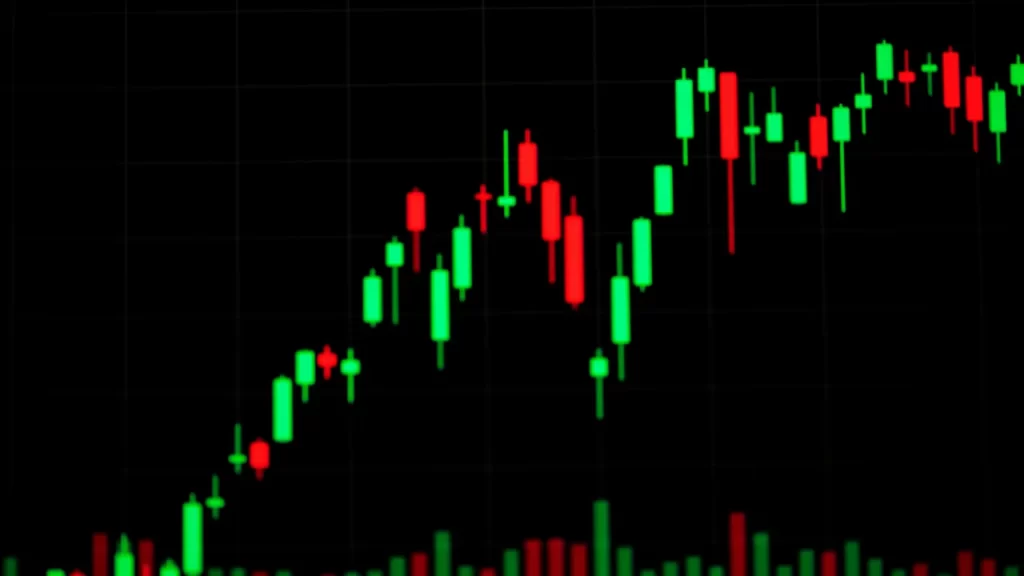
How to Read a Candlestick Chart
Candlestick charts provide more information than line or bar charts. They show open, high, low, and close prices for a specific time period.
Structure of a Candlestick
A candlestick consists of:
- Body: Represents the price range between opening and closing prices.
- Wick (Shadow): Shows the highest and lowest price reached in the time period.
- Color: Green/Blue (Bullish Candle) The price closed higher than it opened. Red (Bearish Candle), The price closed lower than it opened.
Example: If the EUR/USD price opened at 1.1000, moved up to 1.1050, dropped to 1.0980, and closed at 1.1040, a bullish candle would form.
Identifying Market Trends in CFD Trading
A trend is the general direction of an asset’s price over time. There are three main types of trends in CFD trading:
1. Uptrend (Bullish Market)
- Prices consistently form higher highs and higher lows.
- Example: If gold moves from $1800 to $1850 to $1900, it’s an uptrend.
- Trading Strategy: Buy (long) CFDs to capitalize on rising prices.
2. Downtrend (Bearish Market)
- Prices consistently form lower highs and lower lows.
- Example: If the S&P 500 drops from 4,500 to 4,300 to 4,100, it’s a downtrend.
- Trading Strategy: Sell (short) CFDs to profit from declining prices.
3. Sideways Trend (Range-Bound Market)
Prices move within a specific range without a clear trend.
- Example: If Bitcoin fluctuates between $30,000 and $32,000 for weeks, it’s a sideways market.
- Trading Strategy: Buy at support, sell at resistance (range trading).
Essential Candlestick Patterns for CFD Traders
Candlestick patterns help traders anticipate future price movements. Here are the most common patterns:
Bullish Patterns (Indicate Price Increases)
- Doji: A candle with a small body and long wicks, signaling market indecision.
- Hammer: A candle with a small body and long lower wick, indicating a potential uptrend reversal.
- Bullish Engulfing: A large green candle completely engulfs the previous red candle, signaling a strong uptrend.
Bearish Patterns (Indicate Price Decreases)
- Shooting Star: A candle with a small body and a long upper wick, indicating a downtrend reversal.
- Bearish Engulfing: A large red candle engulfs the previous green candle, signaling downward momentum.
- Evening Star: A three-candle pattern where a small-bodied candle appears between a large green and large red candle, indicating bearish sentiment.
These patterns work best when combined with technical indicators for confirmation.
Key Chart Patterns in CFD Trading
In addition to candlesticks, chart patterns help traders predict price breakouts or reversals.
Reversal Patterns (Trend Change Signals)
- Head and Shoulders: A peak (head) between two smaller peaks (shoulders), signaling a trend reversal.
- Trading Tip: Enter a short trade after the neckline breaks.
Double Top & Double Bottom:
- Double Top (Bearish): Price forms two peaks before reversing downward.
- Double Bottom (Bullish): Price forms two troughs before reversing upward.
Wedge Patterns:
- Rising Wedge (Bearish): Price moves upward with decreasing momentum, signaling a reversal.
- Falling Wedge (Bullish): Price moves downward but with decreasing momentum, signaling an upcoming breakout.
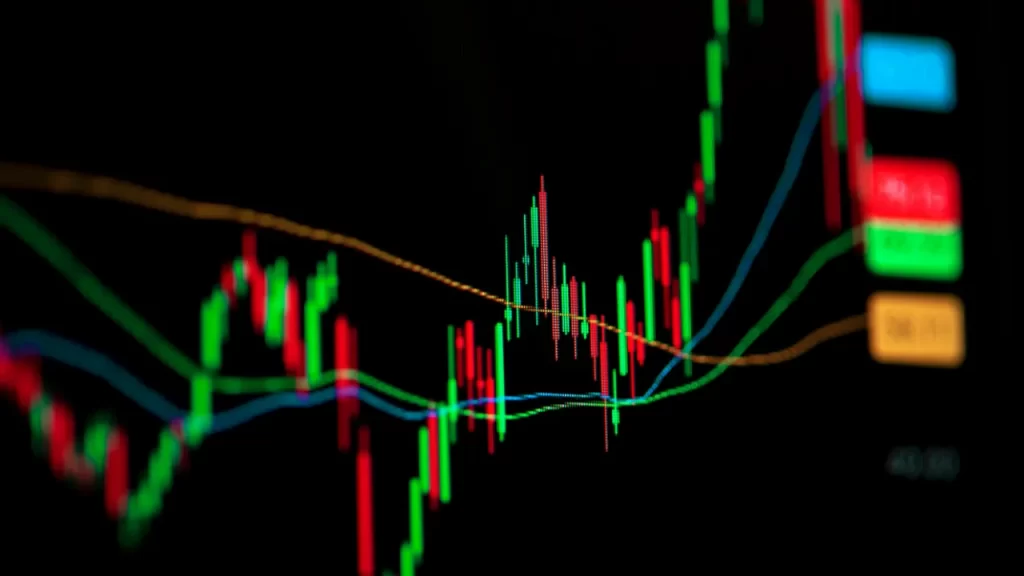
Using Technical Indicators to Improve Chart Analysis
Indicators help confirm trends and entry/exit points. Here are the most commonly used ones:
- Moving Averages (MA) – Identifies trend direction.
Example: A 50-day moving average crossing above a 200-day moving average signals a bullish trend. - Relative Strength Index (RSI) – Measures overbought/oversold conditions.
Example: RSI above 70 = overbought (sell signal), RSI below 30 = oversold (buy signal). - MACD (Moving Average Convergence Divergence) – Helps identify trend changes.
Example: When the MACD line crosses above the signal line, it’s a buy signal. - Bollinger Bands – Measures volatility.
Example: When the price touches the lower band, it may be oversold (buy signal).
Conclusion
Understanding CFD trading charts is crucial for making profitable trades.
By learning how to interpret candlestick patterns, market trends, and key indicators, you can develop a strong trading strategy.
With practice and continuous learning, you’ll become more confident in reading CFD charts and making smarter trading decisions. 🚀📈


