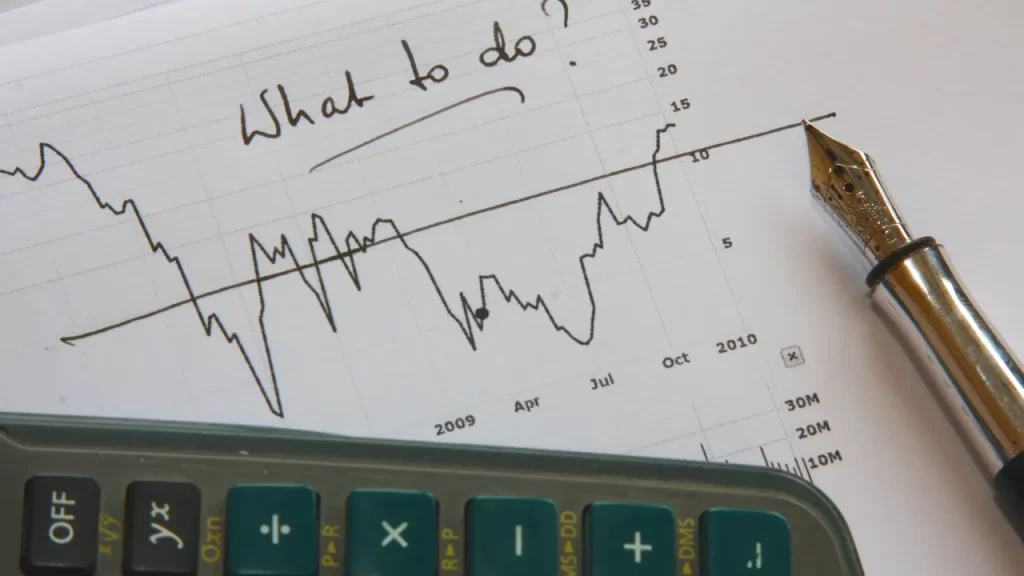
Successful CFD trading relies on market analysis to identify profitable opportunities and make informed decisions.
Traders use different methods to analyze markets, including technical analysis, fundamental analysis, and sentiment analysis.
In this guide, we’ll break down the three main types of market analysis and provide practical tips on how to apply them to CFD trading.

Why Market Analysis is Important in CFD Trading
Market analysis helps traders:
- Identify potential trade opportunities.
- Understand price trends and market conditions.
- Manage risks effectively.
- Increase the probability of making profitable trades.
Without proper analysis, traders rely on guesswork, which often leads to losses.

Three Main Types of Market Analysis
Traders use a combination of these three analysis methods to gain a well-rounded view of the market:
- Technical Analysis – Uses price charts and indicators to predict future price movements.
- Fundamental Analysis – Focuses on economic data, news, and financial reports.
- Sentiment Analysis – Examines market psychology and trader behavior.
Let’s take a closer look at each one.

Technical Analysis: Using Charts to Identify Trends
Technical analysis involves studying price charts and indicators to determine potential future price movements.
It is based on the idea that historical price patterns tend to repeat.
Key Elements of Technical Analysis
Trend Analysis:
- Uptrend – Prices are making higher highs and higher lows.
- Downtrend – Prices are making lower highs and lower lows.
- Sideways/Range Market – Prices move within a defined range.
Support and Resistance Levels:
- Support – A price level where buying pressure prevents the price from falling further.
- Resistance – A price level where selling pressure prevents the price from rising further.
Common Technical Indicators:
- Moving Averages help identify trend direction.
- Relative Strength Index (RSI) measures overbought or oversold conditions.
- MACD (Moving Average Convergence Divergence) detects trend reversals.
- Bollinger Bands identify volatility and price extremes.
- Fibonacci Retracement helps identify support and resistance levels.
How to Use Technical Analysis in CFD Trading
- Use moving averages to confirm trends.
- Identify support and resistance levels before entering a trade.
- Look for breakouts or trend reversals using indicators like MACD or RSI.

Fundamental Analysis: Examining Economic and Financial Data
Fundamental analysis evaluates the underlying factors that influence market prices, including economic data, corporate earnings, and global events.
Key Elements of Fundamental Analysis
Economic Indicators:
- GDP Growth – Strong economic growth can drive bullish markets.
- Interest Rates – Rising rates strengthen a currency, while lower rates weaken it.
- Inflation Data (CPI & PPI) – High inflation can impact market sentiment.
- Employment Reports (NFP, Unemployment Rate) – Job growth indicates economic health.
News and Events:
- Central bank announcements, such as those from the Federal Reserve or ECB.
- Political events, elections, and trade policies.
- Company earnings reports for stock CFDs.
How to Use Fundamental Analysis in CFD Trading
- Monitor economic calendars for upcoming data releases.
- Follow central bank announcements, as interest rate decisions can move markets.
- React to breaking financial news, as unexpected events can create volatility.

Sentiment Analysis: Understanding Market Psychology
Sentiment analysis measures the overall mood of traders in the market. It helps identify whether traders are bullish (optimistic) or bearish (pessimistic).
Key Sentiment Indicators
- The Commitment of Traders (COT) Report shows positioning of institutional traders.
- The Volatility Index (VIX) measures market fear and uncertainty.
- The Put/Call Ratio indicates whether traders are bullish or bearish.
- Market Positioning Reports reveal sentiment in forex and commodity markets.
How to Use Sentiment Analysis in CFD Trading
- Use the VIX index to gauge market fear levels.
- Follow COT reports to see how hedge funds and institutions are positioned.
- Check social media trends for extreme optimism or pessimism.

How to Combine Different Market Analysis Methods
No single method is 100% effective. The best approach is to combine multiple types of analysis to confirm trading decisions.
Example: Using a Combined Approach
- Technical Analysis – Identify an uptrend using moving averages and support levels.
- Fundamental Analysis – Check if there’s a strong economic report or central bank decision supporting the trend.
- Sentiment Analysis – Confirm whether the market is still bullish using sentiment indicators.
By aligning technical, fundamental, and sentiment analysis, traders can increase their chances of success in CFD trading.

Common Mistakes to Avoid in Market Analysis
- Ignoring fundamental events – News and reports can cause sudden market shifts.
- Over-relying on one analysis method – Using only technical or fundamental analysis can lead to incomplete decisions.
- Not managing risk – Even with strong analysis, trading without risk management can lead to losses.
Conclusion
Analyzing the markets correctly is a key skill for CFD traders. By using:
- Technical analysis to find trends and key levels,
- Fundamental analysis to understand economic factors, and
- Sentiment analysis to measure market psychology,
traders can make more informed decisions and improve their success rate.Remember: The best traders use a combination of all three analysis methods to navigate the markets effectively.


