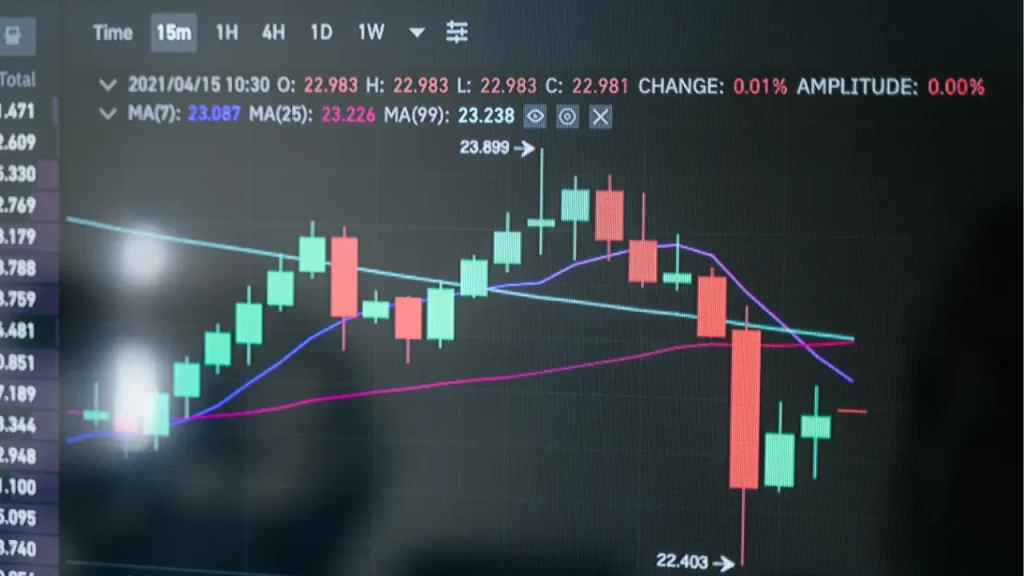

The Simple Moving Average (SMA) calculates the average closing price over a specific period. Commonly used SMAs include the 50-day, 100-day, and 200-day moving averages.
How to Trade with SMA:
- Trend Identification: If the price is above the SMA, it indicates an uptrend; if below, it suggests a downtrend.
- Support & Resistance: The 200-day SMA often acts as strong support in an uptrend and resistance in a downtrend.
- Crossover Strategy: When a short-term SMA (e.g., 50-day) crosses above a long-term SMA (e.g., 200-day), it signals a potential bullish trend (Golden Cross). The opposite is a bearish signal (Death Cross).
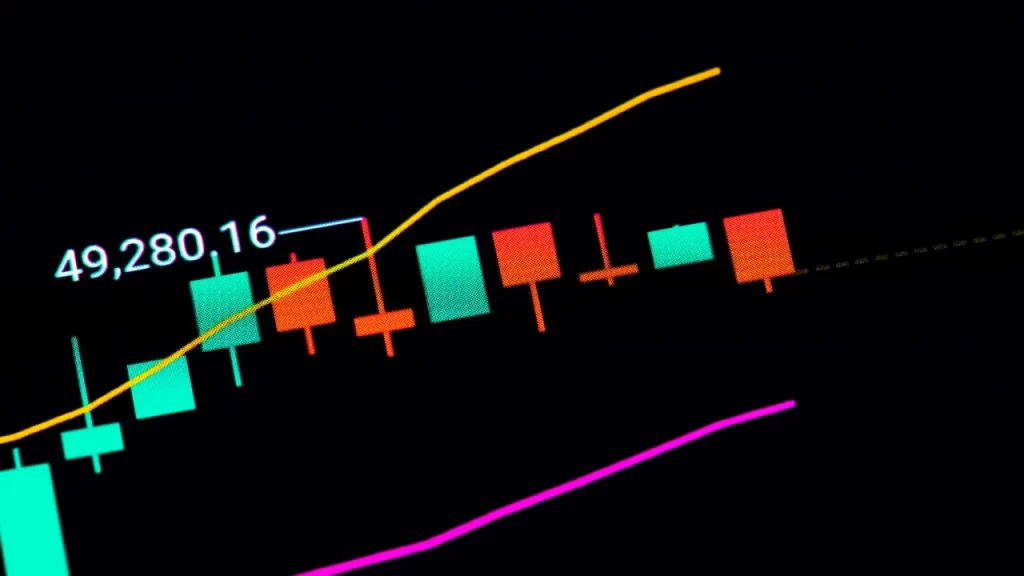
How to Use Exponential Moving Averages (EMA) in CFD Trading
The Exponential Moving Average (EMA) reacts more quickly to price changes than the SMA, making it ideal for short-term trading strategies.
How to Trade with EMA:
- Short-Term Trading: The 9-day and 21-day EMAs are commonly used for spotting quick trend reversals.
- Trend Confirmation: If the price remains above the EMA, it suggests the uptrend is strong. If below, the downtrend is likely to continue.
- Momentum Strategy: Many traders use a crossover between the 12-day and 26-day EMAs to generate buy or sell signals.

Moving Average Crossover Strategies for CFD Trading
A moving average crossover strategy involves using two or more moving averages to identify trend changes.
Popular Crossover Strategies:
- Golden Cross: The 50-day SMA crosses above the 200-day SMA, signaling a strong uptrend.
- Death Cross: The 50-day SMA crosses below the 200-day SMA, indicating a bearish trend.
- Short-Term Crossover: The 9-day EMA crossing above the 21-day EMA signals a buy opportunity, while crossing below signals a sell opportunity.
Using Moving Averages for Support & Resistance
Moving averages often act as dynamic support and resistance levels in CFD trading.
How to Use Moving Averages for Support & Resistance:
- In an uptrend, the moving average acts as support, preventing prices from falling too low.
- In a downtrend, the moving average acts as resistance, stopping prices from rising further.
- The 50-day and 200-day moving averages are commonly used as strong support or resistance levels.
Combining Moving Averages with Other Indicators
To improve the accuracy of trading signals, traders often combine moving averages with other technical indicators.
Effective Indicator Combinations:
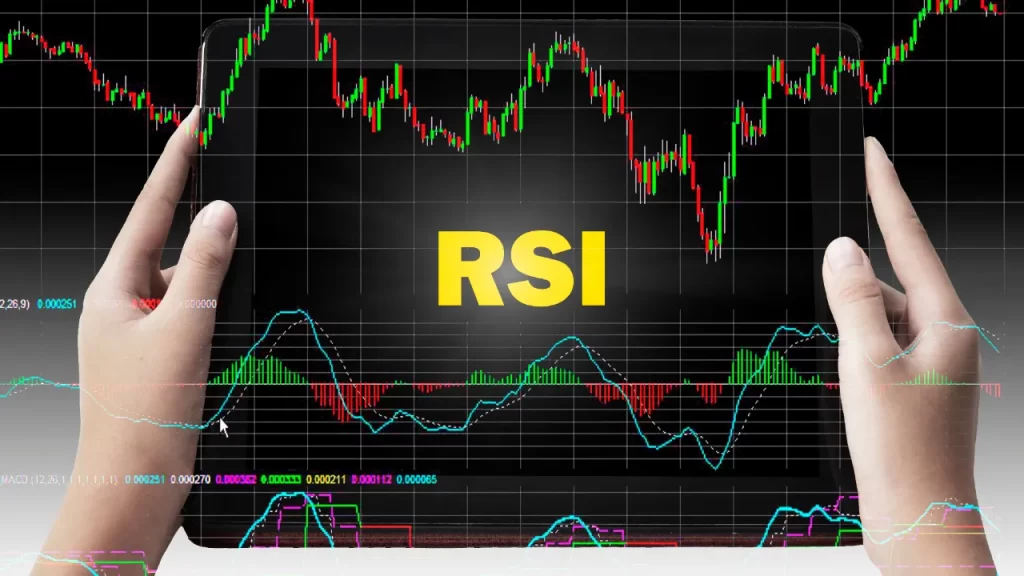
- Moving Averages + RSI: Use the Relative Strength Index (RSI) to confirm whether a market is overbought or oversold before taking action on a moving average signal.
- Moving Averages + MACD: The MACD crossover strategy works well with moving averages to identify trend momentum.
- Moving Averages + Bollinger Bands: Moving averages can help identify trend direction, while Bollinger Bands help spot potential breakouts or reversals.
Best Moving Average Settings for CFD Trading
Different trading styles require different moving average settings.
Recommended Moving Averages Based on Trading Style:
- Day Trading: Use 9-day and 21-day EMAs for quick trend changes.
- Swing Trading: Use 50-day and 100-day SMAs to identify medium-term trends.
- Long-Term Trading: Use 200-day SMA for major trend direction.

Common Mistakes When Using Moving Averages
While moving averages are powerful tools, traders should be aware of common pitfalls.
Mistakes to Avoid:
- Relying on a single moving average: Always confirm signals with other indicators.
- Ignoring market conditions: Moving averages work best in trending markets, not in sideways movements.
- Using the wrong timeframes: Short-term traders should use EMAs, while long-term traders should focus on SMAs.
- Failing to adjust settings: Different assets may require different moving average periods for optimal results.
Final Thoughts
Moving averages are essential tools for trend identification, support/resistance levels, and trade execution.
However, they work best when combined with other technical indicators and proper risk management strategies.


